


ELITE CONTROLLER CHRONICLES
THE CD4 FRAUD

The CD4 Scam
There are two fraudulent markers used by HIV clinics to determine the risk of dying of AIDS. The first is HIV viral load. The second is CD4+ count (CD4+ cells per micro-liter of blood).
Because the HIV viral load is based on imaginary virus particles, it can range over several orders of magnitude – from, say, <20 to > 10 million copies of HIV per mL of blood.
That’s not true of CD4+ count. Cells are real, and can be counted. You can still manipulate the CD4+ count, but only by a couple orders of magnitude (say, 15 to 1500).
There used to be a third marker used by HIV clinics, the CD8+ count. This was popular in the 2000s, specifically the CD4+/CD8+ ratio. But HIV doctors don’t talk about it much anymore.
LISTEN TO THIS ARTICLE
For those T-cell means “thymus-derived lymphocyte”. These cells, which originate in the thymus, supposedly identify and attack cells infected by viruses. (They attack cancerous cells as well. Supposedly.)
Given that viruses are a fiction, and not everyone has cancer, T-cells don’t have a lot to do. They’re probably scrolling TikTok as I write. But let’s continue.
A CD4+ T-cell is a special type of T-cell.
According to Grok:
CD4 is a glycoprotein found on the surface of certain immune cells, primarily T-helper cells, monocytes, macrophages, and dendritic cells. It acts as a co-receptor that assists the T-cell receptor in communicating with antigen-presenting cells, playing a key role in immune system activation. CD4 is also the primary receptor used by HIV to enter and infect host cells.
CD4+ T-cells help coordinate immune responses. But HIV targets and destroys CD4+ cells. A higher CD4+ count (typically 500–1,500 cells per microliter in healthy individuals) indicates better immune function and slower HIV progression. A low count (below 200 cells per microliter) increases the risk of opportunistic infections and AIDS-related complications. Monitoring and maintaining a high CD4+ count through antiretroviral therapy is critical for managing HIV.
So a CD4+ T-cell is just a T-cell which has a CD4 glycoprotein (a protein with some added sugar) on its surface. It “communicates” with cells that have “antigens”, as well as “communicating” with the “HIV” particle. And it “coordinates” immune responses.
Now that that’s clear…
Yes. It’s all bullshit.
The CD4 fraud appears to have originated in the mid 1970s. I tried to track it down to a few papers published in the mid to late 1970s. They’re difficult to read, but some things stand out.
The first step was the “discovery” that T-cells come in two separate types. Here is the abstract from the 1976 paper by Lorenzo Moretta of the University of Genova.
Abstract
Human T lymphocytes in peripheral blood have been shown to have receptors for IgG (T-gamma) or IgM (T-mu). Cultured T-gamma cells do not express receptors for IgM and purified T-mu cells do not have receptors for IgG, thus they appear to be distinct T cell populations. Although the two subpopulations show similar response patterns to concanavalin A, T-mu and T-gamma cells exhibit different dose-response curves to phytohemagglutinin. The normal response pattern to phytohemagglutinin requires a mixture of T cell subpopulations suggesting that synergistic interactions may occur.
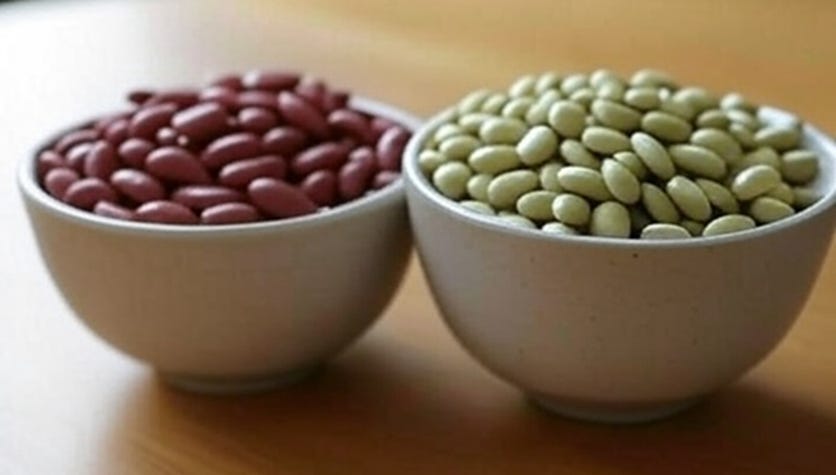
Concanvalin A is a protein derived from the jack bean. Phytohemagglutinin comes from red kidney beans. Each one of them causes blood to clump. According to the abstract, T-gamma and T-mu cells behave similarly to each other when exposed to jack bean gloop, but differently from each other when exposed to red kidney bean gloop.
To All Readerrs: if you get the reference below, we can be friends.)
Here are some charts:
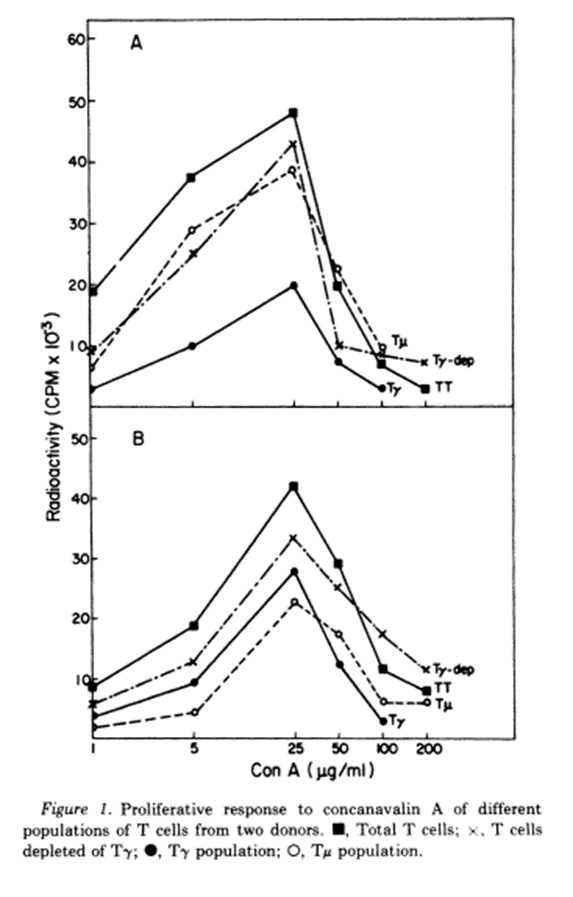
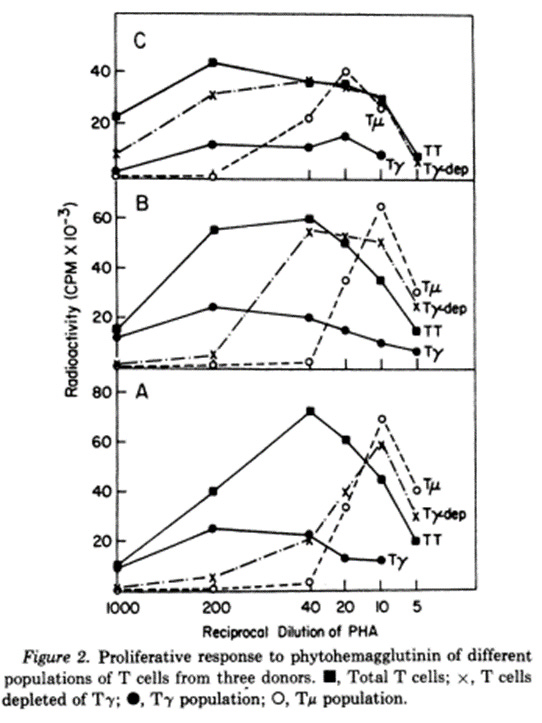
Jack Bean Red Kidney Bean
In the first chart, the peaks of T-gamma and T-mu occur at similar density of jack bean gloop. In the second chart, the T-mu peak occurs at a different density of red kidney bean gloop from the T-peak.
Ergo, there are two kinds of T-cells.
That’s it.
Here’s the authors’ conclusion:
In these experiments we have used an indirect approach to demonstrate that human T lymphocytes bearing receptors for IgG or for IgM represent distinct subpopulations of cells. Thus T-gamma/cells do not form rosettes with IgM-coated ox red blood cells (RBC), and conversely, purified T-mu cells do not rosette with IgG-coated ox RBC. Attempts to demonstrate this point directly by double-labeling experiments were inconclusive for technical reasons. Experiments with fluoresceinated ox RBC coated with IgM and horse RBC coated with IgG (or the reverse) failed to reveal mixed rosettes. In addition, treatment of T cells with heat-aggregated,fluoresceinated human IgG- and IgM-coated ox RBC revealed no rosetted cells which were also fluorescent positive. Although consistent with the notion that T-gamma and T-mu cells are independent, these results were inconclusive …
In other words, there was no direct confirmation that there are two subpopulations of T cells. Results were inconclusive.
And that, ladies and gentlemen, is the “proof” of the existence of T-cell subtypes.
Let’s move onto another paper.
In 1979, building on the work of Moretta, Reinherz et al “proved” the existence of CD4 helper T-cells.
ABSTRACT
A monoclonal antibody was produced to human peripheral blood T cells. This hybridoma antibody, termed OKT4, was reactive by indirect immunofluorescencewith only 55-60% of the peripheral blood T cell population(OKT4+) and unreactive with normal B cells, null cells, andmacrophages. The OKT4- T cell population contained thepreviously described TH2+ subset that has been shown to con-tain cytotoxic/suppressor cells. With cell-sorter separation of OKT4+ and OKT4- cells, it was shown that these T cell subsets were functionally discrete. Both- gave proliferative responses with concanavalin A, alloantigens, and phytohemagglutinin,although OKT4+ cells were much more responsive to the latter. OKT4+ cells alone responded to soluble antigens whereas OKT4- cells alone were cytotoxic after alloantigenic sensitization of unfractionated T cells. However, both OKT4+ and OKT4- cells were required during sensitization for optimaldevelopment of cytotoxicity. These data suggest that the OKT4+ subset represents a helper population and that the OKT4- subset contains the cytotoxic effector population.
OKT4+ = CD4+
OKT4- = CD8+
The first thing they did was to create “monoclonal antibodies” –antibodies that react with a single antigen (“deadly protein”). Polyclonal antibodies are non-specific and supposedly attack lots of antigens at the same time.
To create monoclonal antibodies, they extracted an antigen from sheep blood, and fused it using PEG (same as used in mRNA vaccines) into mouse cancer cells. That’s why they called it a hybridoma antibody – it’s a hybrid of an antigen and a cancer cell (so chosen because it replicates indefinitely.) Then they tagged these monoclonal antibodies with a fluorescent tracer, and mixed them with human T cells, to see the response. The response was measured by a flow cytometer.
What is a flow cytometer?
Grok:
A flow cytometer is an instrument used to analyze the physical and chemical characteristics of cells or particles as they flow in a fluid stream. Here’s how it works in simple terms:
Sample Preparation: Cells are suspended in a fluid and labeled with fluorescent dyes or antibodies that bind to specific cell markers, allowing detection of properties like size, shape, or protein expression.
Fluidics System: The sample is injected into a sheath fluid, which hydrodynamically focuses the cells into a narrow stream, ensuring they pass single-file through the laser beam.
Laser Interrogation: As cells pass through one or more lasers, they scatter light (forward scatter indicates size, side scatter indicates granularity/complexity). Fluorescent labels emit light at specific wavelengths when excited by the laser.
Detection: Photodetectors capture the scattered light and fluorescence. Filters separate different wavelengths, converting the light signals into electrical pulses.
Data Analysis: The electrical pulses are processed by a computer, which generates a multi-parameter dataset. This data is displayed as histograms or dot plots, allowing identification and quantification of cell populations based on their characteristics.
Here are the results.
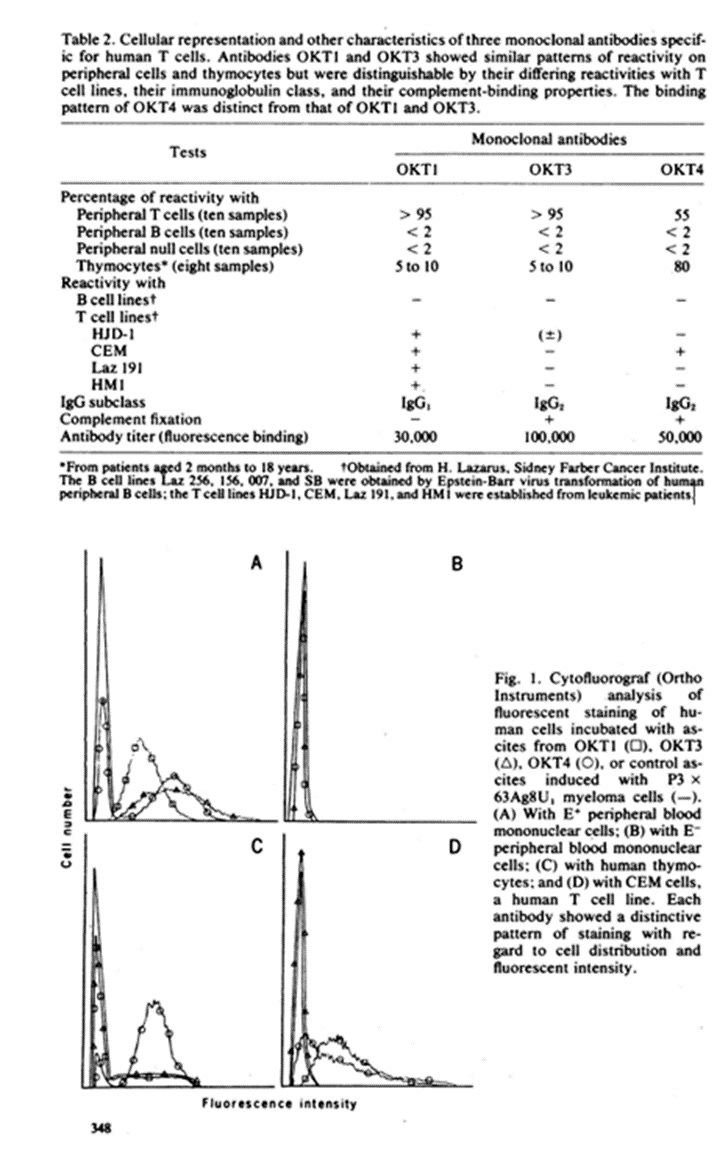
So OKT4 binding to blood cells is different from OKT1 and OKT3 binding.
Within OKT4, there are supposedly two subtypes, OKT4+ and OKT4-. (i.e. CD4+ and CD8+). Let’s start with the OKT4-. How do you infer that it is cytotoxic?
See below.
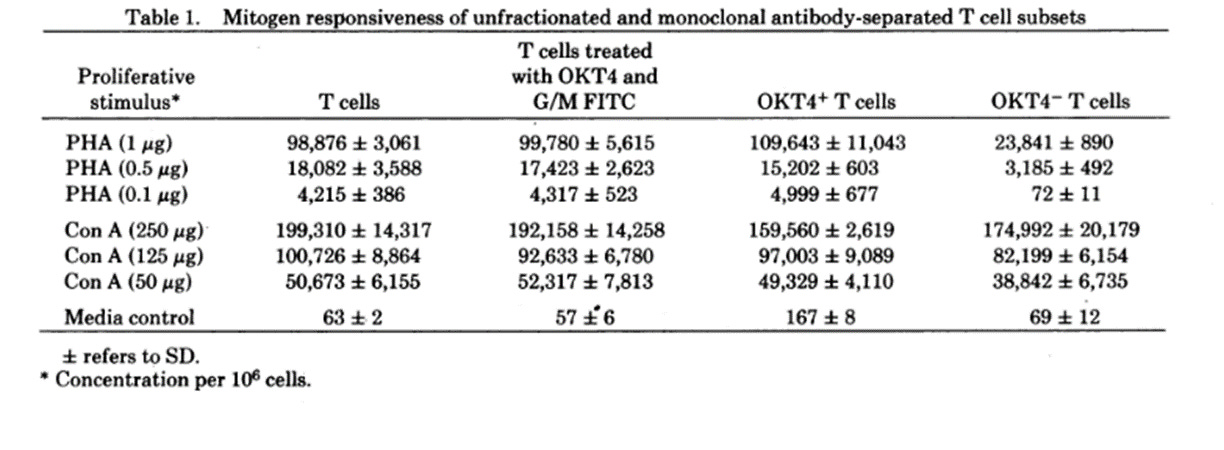
Note: “mitogen responsiveness” is the ability of immune cells to proliferate in the presence of mitogens – i.e. red kidney bean mitogen (PHA) or jack bean mitogen (Con A).
Looking at the top row, when OKT4+ to OKT4- T cells were compared under the influence of red kidney beans, the T4- population was only 25% as high as the T4+ population. That means that T4- cells are allegedly cytotoxic.
However, when they did the same using jack beans (fourth row), there was essentially no difference in responsiveness between T4+ cells and T4- cells.
So, T4- (or CD8+) cells are Cytotoxic in the presence of red kidney beans, but harmless around jack beans. Am I missing something?
What about OKT4+ (CD4+) cells?
A few months later in 1979, Reinherz et al published his findings on OKT4+ cells. Here is the abstract.
Evidence is presented that the OKT4+ T cell subset in man, defined by a monoclonal hybridoma antibody, provides help for B lymphocyte differentiation in a PWM driven system. Both B cell proliferation and intracytoplasmic immunoglobulin synthesis are facilitated by OKT4+ and not by OKT4- T cells. Given earlier studies demonstrating that OKT4+ T cells were necessary for generation of T cytotoxic cells and the present study that OKT4+ T cells are necessary for the differentiation of B cells, it would appear that the OKT4+ population is the major human T helper (inducer) subset.
Note: PWM = pokeweed mitogen. So they branched out from kidney and jack beans into weeds.

Pokeweed
Full disclosure: I didn’t want to buy the article, and I didn’t read it. Therefore, I don’t know how they arrived at the conclusion that OKT4+ cells are “helper” cells. I don’t know what “differentiation of B cells” even means.
But I also find it unsettling that an entirely ficitious industry is based on the “conclusions” of a paper where the abstract uses the language “it would appear”.
It would appear that they are full of shit.
On to Meta-Analyses
Even though CD4+ is fake, let’s look at a meta-analysis on how CD4+ count in patients on ARV relates to immune function and death by AIDS.
Recall that CD4+ counts are measured by our old friend flow cytometry.
“The blood sample is treated with fluorescently labeled monoclonal antibodies that specifically bind to the CD4 protein on the surface of T-cells. A flow cytometer then uses lasers to detect and count the fluorescently tagged CD4+ T-cells as they pass through a detector.
The flow cytometer provides a count of CD4+ T-cells, expressed as cells per microliter of blood. Normal ranges are typically 500–1,500 cells/µL, but this varies by lab and individual factors.
Standardized protocols (e.g., those from the World Health Organization for HIV monitoring) ensure consistency across labs.”
LOL.
So, Grok, is there
1) “consistency across labs”, or
2) do the results “vary by lab and individual factors”?
Several hundred thousand people on ART would like to know.
Let me take a stab at that answering the question. The answer is 2.
You can get any CD4+ count you want between 50 and whatever the “normal range” from a flow cytometer. You can also intentionally reduce the CD4+ count. This is useful for convincing a newly diagnosed HIV+ patient that his immune system is compromised. It worked on me.
All you have to do is decrease the sensitivity of the photomultipler detector used by the flow cytometer. I’m sure you could easily miss half of the CD4+ cells.
Furthermore, who knows how accurately the monoclonal antibodies tag CD4+ cells?
In short, not only are CD4+ cells are bullshit (because there is no immune system) but whatever they mean, they’re not measured consistently.
Which reminds me of the Woody Allen joke:
Two women are having lunch.
First one says: “The food here is terrible!”
The second one says: “Yes, and such small portions!”
Anyway, let’s look at the meta analyses of CD4, HIV viral load, and AIDS
In the November 2008 issue of The Journal of Making Things Up HIV Medicine the authors performed a meta-analysis of all randomized control trials evaluating the effect of ART on the progression to “AIDS” and/or death.
They started with 10,400 potential RCTs, and winnowed it down to 178.
They looked for a relationship between the decline in CD4 count (NOT the absolute CD4 count, nor the percentage decline in CD4 count) between ART patients on two different ART regimens. And then they compared that decline to the probability the patient in one group died of AIDS over a 24 week period (which was the vast majority of studies) or else a 96 week period.
In other words, they looked for patients who died of AIDS after only 6 months of treatment on one form of ART. Hmmm.
And here’s another interesting tidbit. The baseline death rate per year in their meta-analysis was around 6%. In other words, on average, 1 out of 16 patients had died of “something” within a year of being enrolled in these studies.
Did it not occur to EJ Mills, the main author of the paper, that if 6% of the patients in a study on average die in a single year, these patients may have been at death’s door when they were enrolled? Or, another possibility – they were drug addicts who died of overdoses?
In fact, Mills did mention the role of drug overdoses. Which makes it worse.
You can’t make this shit up.
Furthermore, none of these RCTs used a negative control. There wasn’t a “no treatment” arm compared to treatment. They only compared groups on one ART regimen to another regimen.
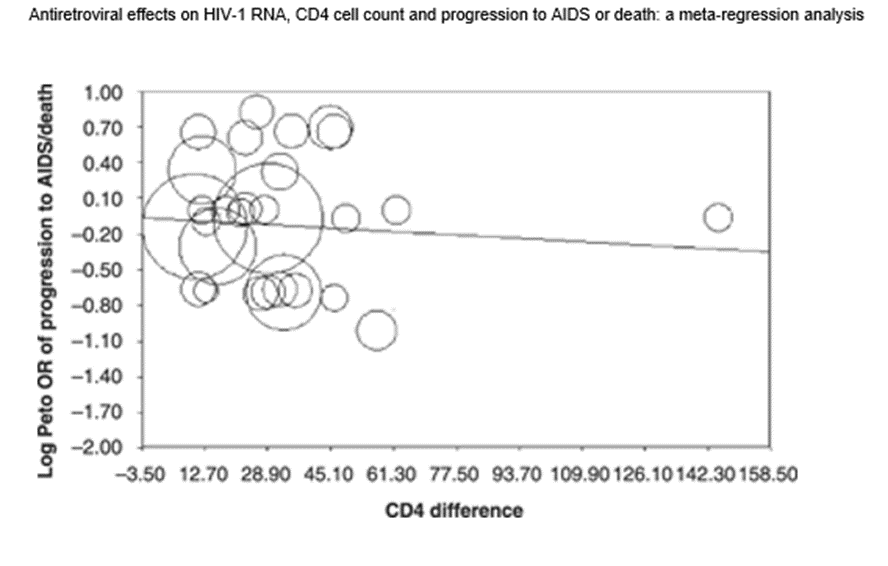
Below is the predicted useless result. The average difference in CD4+ counts over 24 weeks between the two ART groups was only 30. (I believe the average absolute CD4+ was said to be around 200-250. Meaning they measured things differently back then.)
And as you can see from the stupid chart below, there was no correlation of anything with anything.
In a future Elite Controller Chronicles, I’ll talk about the work of Gerd Gigerenzer and the statistical illiteracy of virtually everyone in the medical profession.
The entire field of HIV and its related blood tests is total garbage.
My message to all those diagnosed as HIV positive, who are coming off ART, is to ignore whatever CD4+ count they tell you. It means nothing.
🤯 I hate kidney beans.
"In HIV infection, CD4+ T cells often exhibit altered glutathione homeostasis, with decreased glutathione levels and an increased ratio of oxidized glutathione, which can be a significant factor in disease progression. This dysregulation can lead to impaired T cell function and reduced survival".
+Often, but not always, meaning sometimes. So flip a coin.
Because AIDS is basically a disease of deficiency caused by chronic exposure to toxins, and is curable if caught in time by repletion of deficiencies AND abstinence from exposure.
Kinda like scurvy but that's another story.